Bank Secrecy Act (BSA) Metrics FY25: Quantifying the Investigative Power of Financial Intelligence
The Bank Secrecy Act (BSA) remains one of the most powerful financial intelligence frameworks supporting U.S. law enforcement. The newly released BSA Metrics FY25 (Publication 6129, February 2026) highlights the measurable impact of BSA data on investigations conducted by IRS Criminal Investigation (IRS-CI), demonstrating how Suspicious Activity Reports (SARs), Currency Transaction Reports (CTRs), and Form 8300 filings continue to accelerate financial crime enforcement .
This article provides a detailed breakdown of the FY25 metrics and explains their significance for compliance professionals, financial institutions, and policymakers.
BSA Data as a Core Investigative Engine
As stated in the FY25 report (page 1), BSA data is described as a critical component in identifying and investigating increasingly complex financial crimes . The metrics clearly demonstrate that BSA filings are not passive regulatory submissions—they actively drive enforcement outcomes.
3.9 Million Searches in FY25
- 3.9 million+ BSA searches were conducted in FY25
- IRS-CI cases were searched against BSA data 94% of the time in FY25
Breakdown of FY25 searches:
- 2.2 million searches against SARs
- 1.0 million searches against CTRs
Three-year averages (FY23–FY25):
- 2.6M+ yearly BSA searches
- 2.2M+ SAR searches
- 866,178 CTR searches
Interpretation: Nearly every IRS-CI case touches BSA data. For AML teams, this confirms that regulatory filings directly influence investigative workflows.
BSA Filings Directly Associated with Investigations
88.6% of Investigations Involved BSA Filings
In FY25:
- 88.6% of investigations opened by IRS-CI had one or more BSA filings associated with the primary subject
Breakdown of filing types associated with primary subjects:
- 79.7% SAR
- 66.8% CTR
- 11.5% Form 8300
This indicates SARs remain the dominant trigger, but CTRs play a critical complementary role.
BSA-Initiated Investigations
Notably:
- 11.7% of all investigations opened in FY25 originated directly from a BSA filing
Of these BSA-initiated cases:
- 89.3% originated from a SAR
- 9.2% from a CTR
- 1.5% from Form 8300
Key Insight: While SARs dominate originations, CTR-only cases still produce measurable enforcement outcomes—particularly when aggregation is involved.
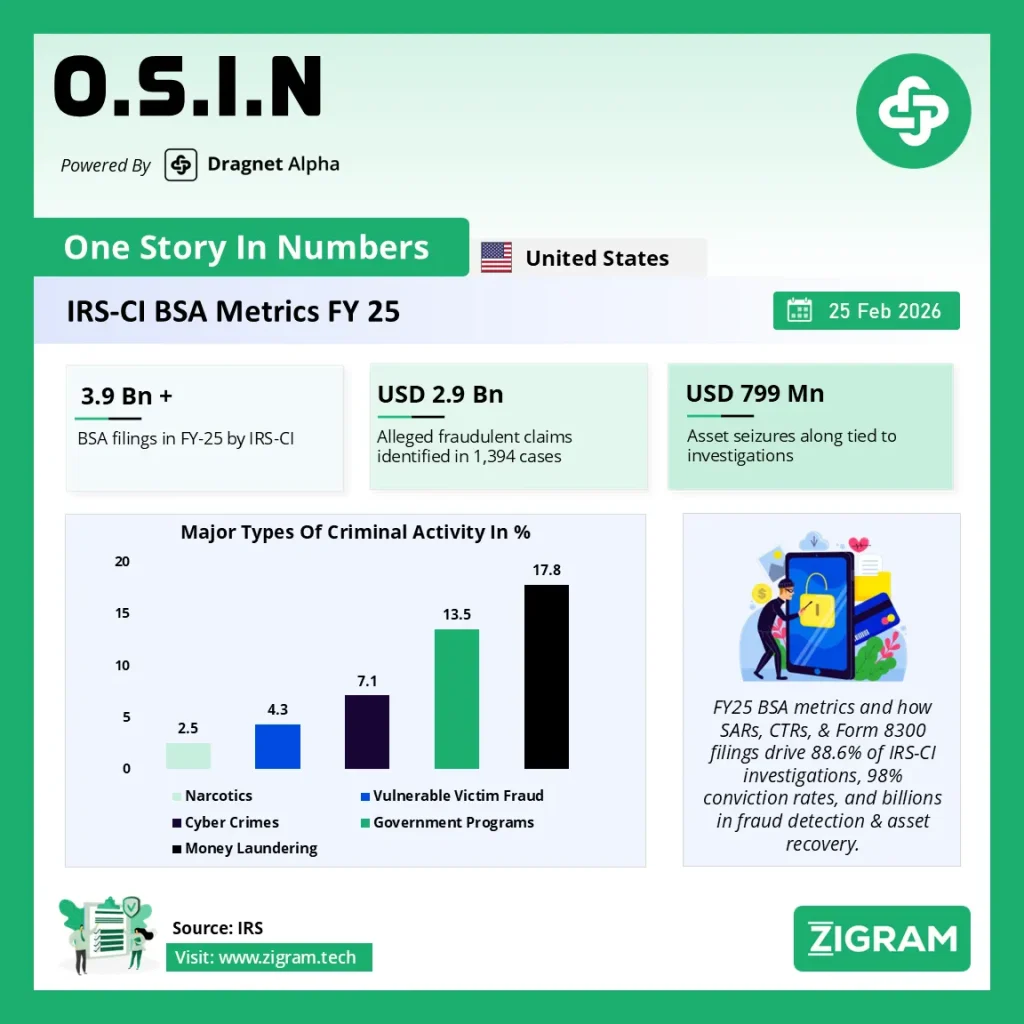
Criminal Activity Breakdown
The types of criminal activity identified in BSA-initiated investigations (page 1 chart) include :
- 17.8% – Money laundering
- 13.5% – Fraud tied to government programs
- 7.1% – Cybercrimes
- 4.3% – Vulnerable victim fraud
- 2.5% – Narcotics
This distribution underscores the broad utility of BSA intelligence beyond tax enforcement.
CTR Threshold Analysis: $10,000 vs $20,000
Page 2 provides a detailed assessment of the investigative impact of the CTR threshold .
Key Findings:
- 66.8% of FY25 investigations had at least one CTR associated with the primary subject
- 95.9% of investigations involving a seizure had one or more BSA filings associated with the primary subject
Median transaction values:
- $12,000 median cash in
- $12,543 median cash out
This is critically important: median amounts cluster just above the $10,000 reporting threshold.
Aggregated CTRs
- 96.1% of investigations with an associated CTR had at least one aggregated CTR
- 67–74% of CTR-only investigations involved aggregated CTRs below $20,000
Policy Implication: Raising the CTR threshold to $20,000 could significantly impact investigative visibility, particularly for structured or aggregated transactions.
Enforcement Outcomes
The prosecutorial impact of BSA data is substantial :
- 98% conviction rate
- 42-month average sentence
- 88.6% of investigations recommended for prosecution had BSA filings
Asset recovery metrics:
- $799M in asset seizures
- $454M in asset forfeitures
- $498M in restitution
These figures demonstrate that BSA intelligence translates directly into tangible enforcement results.
Fraud & Employment Tax Enforcement
Fraud, Waste & Abuse (e.g., refund fraud, ERC claims)
- 1,394 investigations opened
- $2.9B in alleged fraudulent claims
- 99% had one or more BSA filings associated
Employment Tax Investigations
- 1,006 investigations opened
- $1.4B in alleged employment tax evasion
- 63% had associated BSA filings
These numbers show that BSA intelligence is deeply embedded in large-scale fraud enforcement.
Strategic Takeaways for Compliance Leaders
SAR Quality Directly Influences Enforcement
With 89% of BSA-initiated cases stemming from SARs, narrative quality and contextualization matter significantly.
- CTRs Remain Critical Despite Debate
Aggregation below $20,000 plays a measurable investigative role. - BSA Data Drives Asset Recovery
Nearly all seizure-related cases involve BSA filings. - Government Program Fraud Detection Depends on BSA Signals
Particularly relevant post-pandemic, where refund and ERC fraud remain priorities.
Conclusion
The FY25 BSA Metrics report demonstrates that financial intelligence reporting is not merely regulatory compliance—it is an operational enforcement multiplier.
With:
- 3.9M+ searches,
- 88.6% investigation association rate,
- 98% conviction rate,
- and billions in fraud identified,
BSA filings continue to function as one of the most effective public-private intelligence bridges in combating financial crime.
For compliance professionals, the message is clear: well-structured, timely, and analytically rich filings materially impact investigative success.
- #BankSecrecyAct
- #BSAMetricsFY25
- #IRS_CI
- #AMLCompliance
- #SuspiciousActivityReports
- #CurrencyTransactionReports
- #FinancialCrime
- #FraudPrevention
- #AntiMoneyLaundering
- #RegulatoryCompliance